← Back to Dashboard
DECS-S-0034

πŸ“˜ Statistical Models and Management Analysis

Statistical foundations for managerial decision-making β€” regression analysis, hypothesis testing, predictive modeling, and data-driven management.

πŸ”· Key Frameworks

Linear Regression Multiple Regression Hypothesis Testing Confidence Intervals Probability Theory Central Limit Theorem t-Distributions ANOVA (Analysis of Variance)
Study Materials Final Exam Solutions (40 Questions) & Case Exercises
Complete walkthrough of all 40 quiz questions verified against original screenshots plus Cashing Out & January Effect case exercise guides

Linear Regression

Models the relationship between a dependent variable and one independent variable. Estimates how changes in the predictor affect the outcome. Foundation for business forecasting, trend analysis, and understanding cause-effect relationships.

Multiple Regression

Extends linear regression to include two or more independent variables. Enables managers to isolate the impact of individual factors while controlling for others. Essential for multivariate business analysis and predictive modeling.

Hypothesis Testing

A formal statistical procedure to evaluate claims about population parameters using sample data. Involves null and alternative hypotheses, significance levels, p-values, and Type I/II errors. Core framework for evidence-based management decisions.

Confidence Intervals

A range of values that likely contains the true population parameter with a specified level of confidence (e.g., 95%). Provides managers with an estimate of uncertainty around sample statistics, crucial for risk-aware decision-making.

Probability Theory

The mathematical foundation for quantifying uncertainty. Covers probability rules, conditional probability, Bayes theorem, and probability distributions (binomial, normal, Poisson). Underpins risk assessment and decision analysis in management.

Central Limit Theorem

States that the sampling distribution of the sample mean approaches a normal distribution as sample size increases, regardless of the population distribution. Justifies the use of normal-based inference in business analytics.

t-Distributions

A family of distributions used when population standard deviation is unknown and sample sizes are small. Heavier tails than the normal distribution. Critical for small-sample hypothesis testing and confidence interval construction in business research.

ANOVA (Analysis of Variance)

A statistical technique for comparing means across three or more groups. Tests whether observed differences are statistically significant. Used in market segmentation, A/B testing, and comparing business unit performance.

πŸ“š Course Topics

Descriptive Statistics and Data Visualization for Managers Probability Theory and Probability Distributions (Binomial, Normal, Poisson) Sampling Methods and Sampling Distributions Central Limit Theorem and Its Business Applications Point Estimation and Confidence Interval Estimation One-Sample and Two-Sample Hypothesis Testing (z-test, t-test) Chi-Square Tests for Categorical Data Simple Linear Regression: Estimation, Inference, and Prediction Multiple Regression: Model Building, Interpretation, and Diagnostics ANOVA: One-Way and Two-Way Analysis of Variance Model Assumptions, Residual Analysis, and Diagnostics Multicollinearity, Heteroskedasticity, and Autocorrelation Dummy Variables and Interaction Effects in Regression Model Selection: Stepwise, Forward, Backward, and Best Subsets Statistical Software Applications (Excel, SPSS, R, Python) Managerial Interpretation of Statistical Output Predictive Modeling and Forecasting for Business Decisions Statistical Process Control and Quality Management Decision Trees and Expected Value Analysis Ethics in Data Analysis and Statistical Reporting

🎬 Pre-Study Resources

Curated YouTube lectures and explainers to prepare before class. Click any card to watch.

Simple Linear Regression: An Easy and Clear Beginner Guide
numiqo
Covers the basics of Simple Linear Regression: what it is, how it works, and why it is useful for business analytics and
Simple Linear Regression for Managers: Predicting Business Outcomes with Excel
DJB Speaks
Practical guide for EMBA students and professionals on building predictive models with simple linear regression using Ex
Business Interpretation of Linear Regression - Business Intelligence with Data Mining
Chitu Okoli
Non-mathematical explanation of how linear regression equations translate into actionable business insights.
Multiple Regression for beginners
Global Health with Greg Martin
Walks through simple and multiple regression analysis, explaining how multiple regression differs by incorporating more
Business Statistics Lesson 14: Multiple Regression Analysis
Luther Maddy - Helping Humans Learn
Covers correlation coefficients, dependent/independent variables, and performing linear regression manually and with Exc
Multiple Linear Regression Analysis (Business Statistics) For MBA
EduMCQ Mastery
Detailed explanation of Multiple Linear Regression Analysis tailored specifically for MBA students in business statistic
Hypothesis Testing and The Null Hypothesis, Clearly Explained
StatQuest with Josh Starmer
Clear, visual explanation of hypothesis testing and the null hypothesis β€” one of the most fundamental concepts in statis
ANOVA - A Full Lecture to learn Analysis of Variance
numiqo
Full free course on analysis of variance exploring what ANOVA is, why you need it, and how to apply it in business, rese
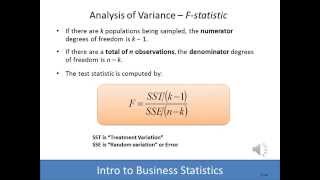
Business Statistics Lesson 12: Analysis of Variance ANOVA
Luther Maddy - Helping Humans Learn
Explains ANOVA computation with two or more variances, comparing three or more means with additional examples and downlo
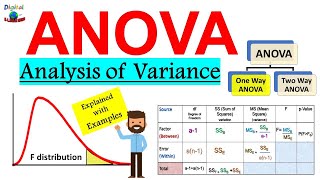
What is ANOVA (Analysis of Variance) in Statistics? Explained with Examples (ANOVA F-test)
Digital E-Learning
Comprehensive exploration of ANOVA analysis of variance with practical examples including the F-test.
Confidence Interval [Simply explained]
numiqo
Explains how population parameters are estimated based on samples, covering confidence intervals for means and variances
Confidence Intervals, Clearly Explained
StatQuest with Josh Starmer
Demystifies confidence intervals using bootstrapping β€” makes a potentially confusing concept intuitive and accessible.
But what is the Central Limit Theorem?
3Blue1Brown
Award-winning visual introduction to probability most important theorem. Shows why the normal distribution appears every
The central limit theorem | Explained with a simple example
TileStats
Explains the CLT with a simple, intuitive example β€” one of the most fundamental concepts in statistics for business appl
Statistics: Degrees of Freedom and Using a T-table
Emporium Mathematics
Defines degrees of freedom and demonstrates how to use a t-table to find critical values for hypothesis testing with sma
T-Distribution Explained: When Sigma Is Unknown (Statistics 101)
CodeLucky
Visualizes how the t-distribution differs from the standard normal distribution, explaining degrees of freedom and heavi
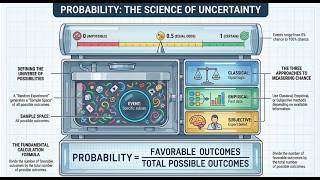
Probability for Business and Management: Uncertainty, Risk and Decision Making
Riyath Ismail
In-depth session exploring the fundamental concept of probability β€” quantifying uncertainty to aid managerial decision-m
Conditional Probability for Managers: Solving Real-World Business Problems
DJB Speaks
Practical application of conditional probability to real-world business problems, bridging theory and managerial practic
⚠️ Pre-Study Note: These are supplementary resources curated to help you prepare for this course. They are not official Sasin materials. Always prioritize your course syllabus and instructor guidance. AI-generated research β€” verify key facts independently.